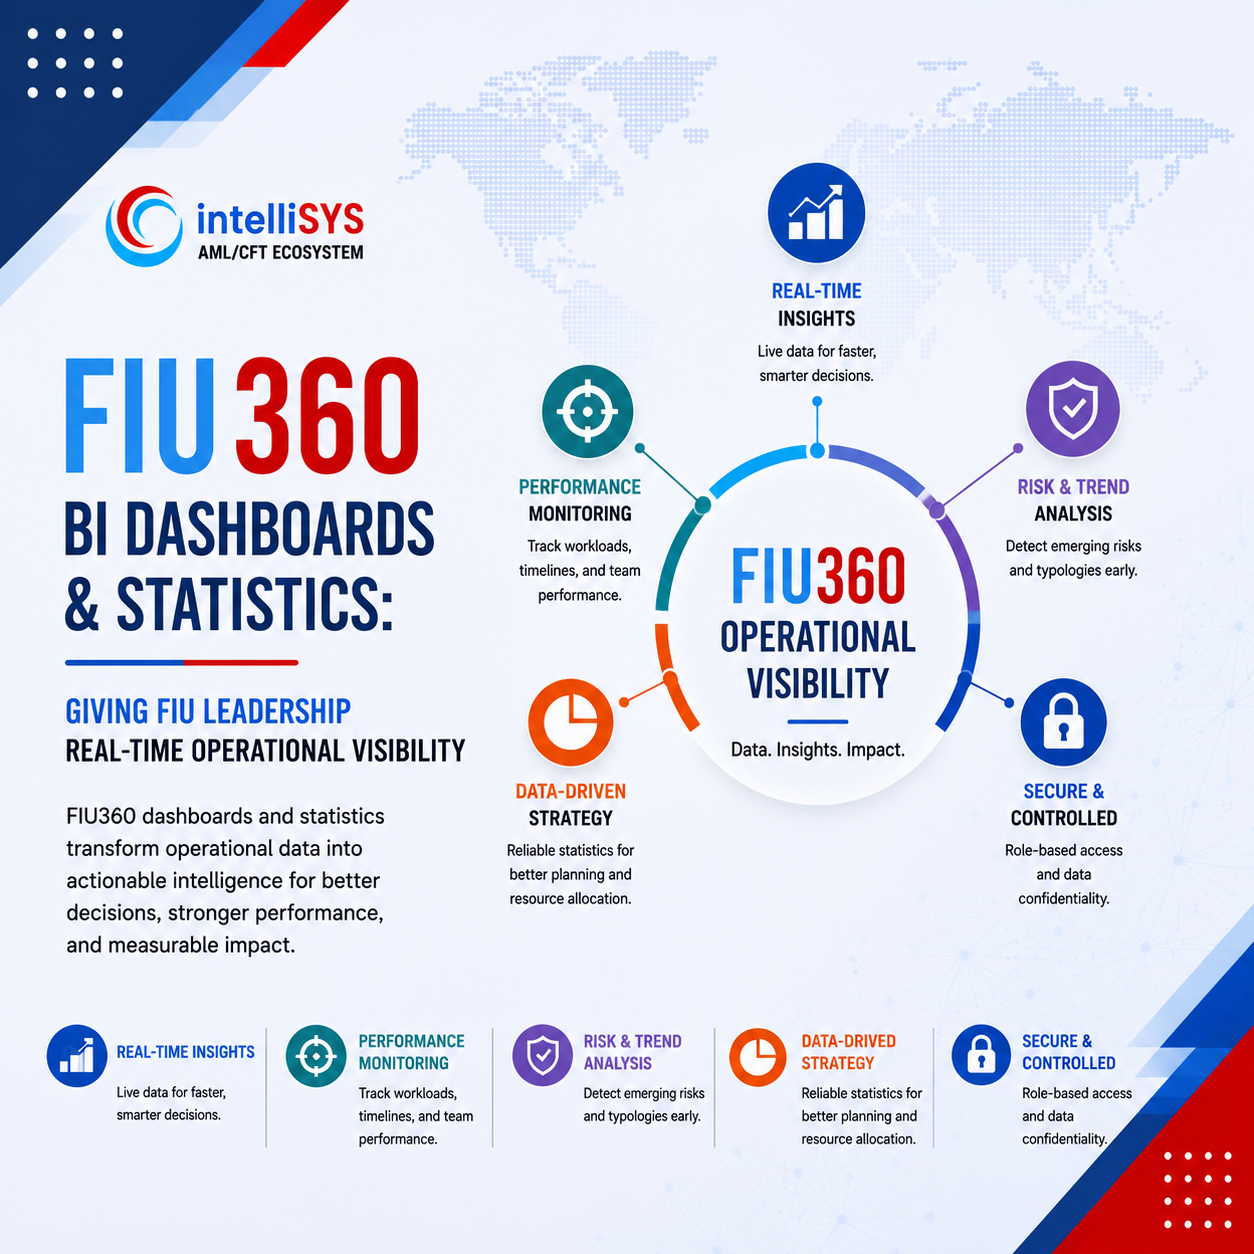
Financial Intelligence Units need more than analytical tools for individual cases. They also need management visibility over the entire FIU operation. Leadership must understand how many reports are being received, which sectors are reporting, how quickly reports are processed, which cases are delayed, how analysts are performing, what typologies are emerging, and whether disseminated intelligence is producing useful outcomes. Without reliable dashboards and statistics, FIU management may depend on manual reports, spreadsheets, delayed updates, and fragmented information. FIU360 helps address this challenge through BI dashboards, statistics, reporting services, KPIs, and operational monitoring tools designed for modern Financial Intelligence Units.
A Financial Intelligence Unit is both an intelligence organization and an operational institution.
It must receive reports, manage workflows, enrich data, analyze cases, protect sensitive information, disseminate intelligence, cooperate with competent authorities, and demonstrate effectiveness.
Leadership cannot manage this environment effectively without visibility.
If management does not know where delays occur, which teams are overloaded, which report types are increasing, or which sectors are generating weak reports, it becomes difficult to improve performance.
FIU dashboards give leadership a clearer view of what is happening inside the institution.
They help move management from periodic manual reporting to real-time operational oversight.
Many FIUs still rely heavily on manual management reporting.
Statistics may be prepared in spreadsheets. Case updates may be requested by email. Analysts may manually count reports, disseminations, delays, or feedback. Annual reporting may require significant effort because the data is spread across systems, documents, and case files.
This approach is slow and vulnerable to errors.
It also limits management’s ability to respond quickly.
By the time a manual report is prepared, the operational situation may already have changed. A backlog may have grown. A high-risk case may be delayed. A reporting sector may have submitted a sudden increase in suspicious activity.
Modern FIUs need dashboards that reflect operational reality more quickly.
FIU360 BI dashboards help transform operational data into management intelligence.
Instead of viewing FIU work only at the level of individual reports or cases, leadership can monitor wider patterns across the institution.
Dashboards may show report volumes, case status, workflow performance, analyst workload, processing times, dissemination activity, feedback results, risk categories, reporting entity behavior, and typology trends.
This creates a stronger decision-making foundation.
Management can identify pressure points, allocate resources, monitor performance, and support strategic planning based on structured data rather than assumptions.
Report volume is one of the most basic but important indicators for FIU management.
Leadership needs to know how many reports are being received, which types of reports are increasing, and which reporting sectors are contributing to the workload.
FIU360 supports visibility across different report types, including suspicious transaction reports, suspicious activity reports, currency transaction reports, electronic funds transfer reports, terrorist financing reports, politically exposed person-related reports, and other disclosures.
This helps the FIU understand the scale and direction of incoming work.
If one sector suddenly increases its reporting, the FIU can investigate whether this reflects better compliance, new risks, regulatory changes, or reporting quality issues.
Not all reporting entities perform in the same way.
Some institutions may submit high-quality reports with complete information and strong narratives. Others may submit weak reports with missing data, inconsistent structures, or repeated errors.
FIU360 dashboards and statistics can help management identify these patterns.
This supports targeted outreach, training, supervisory engagement, and reporting improvement programs.
Instead of treating poor reporting quality as an isolated analyst problem, the FIU can monitor reporting behavior at institutional and sector level.
This helps strengthen the national AML/CFT reporting ecosystem.
Data quality affects the entire FIU lifecycle.
If reports are incomplete or incorrectly formatted, analysts spend time correcting data instead of analyzing risk.
FIU360’s structured data collection and validation capabilities can support statistics on submission quality, correction requests, failed validations, missing fields, and recurring data issues.
This information is valuable for management.
It helps identify where reporting entities need guidance. It also helps the FIU improve schemas, validation rules, reporting instructions, and sector-specific outreach.
Good dashboards can turn data quality problems into measurable improvement actions.
FIU workflows include many steps.
A report may move through intake, validation, triage, enrichment, analysis, case creation, supervisory review, dissemination, and feedback tracking.
FIU360 can help track how long these steps take and where delays occur.
This is important because backlogs are often hidden inside workflow stages.
A case may not be delayed overall because of analyst review alone. The delay may be caused by enrichment requests, supervisory approval, document preparation, or dissemination review.
Workflow dashboards help leadership see where the process slows down.
This supports better process improvement.
FIU managers must understand workload distribution.
Some analysts may handle high volumes of standard reports. Others may work on fewer but more complex cases. Some teams may face sudden increases in workload due to emerging typologies or sector reporting patterns.
FIU360 dashboards can support visibility over assigned tasks, pending work, case volumes, processing times, and workload distribution.
This helps supervisors and managers allocate work more effectively.
It also supports more informed staffing and training decisions.
Workload monitoring should not be used only for performance pressure. It should help ensure that analysts have the capacity and support needed to produce quality intelligence.
Not all cases require the same level of management attention.
High-risk cases involving terrorism financing, corruption, organized crime, sanctions exposure, politically exposed persons, or major cross-border flows may require closer monitoring.
FIU360 can help leadership track cases by risk level, sensitivity, case type, status, workflow stage, and assigned officer.
This helps ensure that priority matters remain visible.
A high-risk case should not be lost inside a general backlog.
Dashboards support a risk-based management view where leadership can focus on the matters with the greatest intelligence and operational importance.
An FIU’s value is not measured only by the number of reports it receives.
A more important question is whether the FIU produces useful intelligence.
FIU360 can support dashboards and statistics around dissemination activity and feedback. Management can monitor how many intelligence packages were sent, which authorities received them, what typologies they involved, and whether feedback was returned.
This helps close the intelligence loop.
If law enforcement feedback shows that certain intelligence products are highly useful, the FIU can reinforce those practices. If feedback is weak or missing, the FIU can improve cooperation mechanisms.
Dissemination dashboards help leadership understand the practical impact of FIU outputs.
Many FIUs must prepare annual reports, operational reports, institutional performance summaries, or statistics for national stakeholders.
Manual preparation can consume significant time.
FIU360 statistics and reporting services can help generate structured information for these reporting needs.
This may include report volumes, sector distribution, case statistics, dissemination activity, typology trends, processing times, feedback outcomes, and operational performance indicators.
When the underlying data is already captured in the system, annual reporting becomes more reliable and less dependent on manual reconstruction.
This improves both efficiency and accuracy.
FIUs may need to demonstrate operational effectiveness during national reviews, mutual evaluations, or institutional assessments.
This requires evidence.
Leadership may need to show how reports are received, how they are analyzed, how cases are prioritized, how intelligence is disseminated, how feedback is managed, and how cooperation works.
FIU360 dashboards and statistics can help provide this evidence.
Technology alone does not prove effectiveness. However, structured data and reliable reporting make it easier for the FIU to demonstrate how its processes operate in practice.
This supports better institutional readiness.
Dashboards are not only useful for management.
They can also support strategic intelligence.
Over time, FIU360 can help identify patterns across report types, sectors, regions, typologies, legal entity structures, transaction channels, and risk categories.
This can help the FIU understand national financial crime trends.
For example, a dashboard may show an increase in reports related to trade activity, cash-intensive businesses, cross-border transfers, or specific professional sectors.
These trends can inform strategic analysis, typology reports, outreach programs, supervisory priorities, and National Risk Assessment inputs.
Operational data becomes a source of strategic insight.
High-level dashboards are useful, but management often needs to understand the detail behind a number.
If report volumes increase, which sector caused the increase?
If a workflow is delayed, which step is responsible?
If a reporting entity has repeated validation errors, which fields are causing the issue?
If disseminations increased, which typologies are involved?
FIU360 supports drill-down reporting so that users can move from summary indicators to more detailed views.
This is important because dashboards should not only show problems. They should help management investigate them.
A useful dashboard leads to action.
FIU managers and stakeholders may need regular reports.
A supervisor may need a weekly workload report. Management may need a monthly performance summary. A strategic analysis unit may need periodic trend statistics. Senior leadership may need high-level dashboards for institutional oversight.
FIU360 can support scheduled and push reporting.
This helps ensure that relevant information reaches the right people at the right time.
Instead of manually preparing the same reports repeatedly, the system can support more consistent reporting routines.
Supervisors need practical visibility, not only strategic dashboards.
They need to know which tasks are pending, which analysts need support, which cases are overdue, and which reports require review.
FIU360 workflow and dashboard capabilities help supervisors manage daily operations more effectively.
This improves responsiveness.
Instead of waiting for analysts to provide manual updates, supervisors can monitor workflow status directly inside the platform.
This creates a more disciplined operating environment.
FIU executives need a different level of reporting.
They may not need to see every task, but they need to understand institutional performance, resource pressure, risk trends, cooperation outcomes, and modernization priorities.
FIU360 dashboards can support executive-level views that summarize the most important indicators.
This helps leadership answer practical questions:
Are report volumes increasing?
Are high-risk cases being processed on time?
Which sectors need stronger engagement?
Are analysts overloaded?
Are disseminations producing feedback?
Which typologies are becoming more common?
Where should the FIU invest next?
Better visibility supports better governance.
Consider an FIU receiving a growing number of STRs from several sectors.
At the report intake level, the increase may appear manageable. However, the dashboard shows that reports involving legal entities and cross-border transfers are taking longer to process.
A drill-down view reveals that enrichment and supervisory review are the main delay points.
With this information, management can take action.
The FIU may assign more analysts to complex entity cases, adjust workflow rules, improve enrichment integration, or create a dedicated review team for high-risk cross-border cases.
Without dashboards, the backlog may remain hidden until it becomes a serious operational problem.
A dashboard shows that several reporting entities repeatedly fail validation checks for the same fields.
The FIU can use this information to support targeted outreach.
Instead of issuing broad guidance to the entire sector, the FIU can identify the institutions and report fields causing the most problems.
This improves training efficiency and helps reduce correction workload.
Over time, the FIU can monitor whether reporting quality improves.
This turns reporting quality management into a measurable process.
Management reviews dissemination statistics and notices that intelligence packages related to a specific typology receive more frequent law enforcement feedback than other categories.
This may indicate that the typology is operationally important or that the FIU’s intelligence products in that area are particularly useful.
The FIU can use this information to refine analytical priorities, develop strategic reports, improve templates, or allocate specialized resources.
Feedback and dissemination dashboards help connect FIU activity with real-world intelligence value.
Dashboards should create clarity, not noise.
A system can generate many indicators, but not every indicator is useful for management.
FIU360 dashboards should be configured around the FIU’s operational priorities, legal obligations, leadership needs, and strategic goals.
Useful dashboards focus on decision-making.
They show what needs attention, what is changing, what is delayed, what is high risk, and what action may be required.
A good BI implementation helps the FIU avoid excessive reporting and focus on meaningful indicators.
Management reporting should be based on trusted data.
If statistics are prepared manually, numbers may be inconsistent across departments or reporting periods.
FIU360 helps improve reliability by generating statistics from platform activity, workflow records, report data, case records, dissemination logs, and structured operational information.
This supports better governance.
Leadership can rely on system-based reporting rather than manually assembled figures that may be difficult to verify.
Reliable data improves institutional accountability.
FIU360 BI dashboards are powerful because they connect operational activity with management oversight.
They help FIUs monitor report volumes, data quality, workflow performance, analyst workloads, case status, risk categories, dissemination outcomes, feedback, and strategic trends.
This gives FIU leadership a clearer understanding of both daily operations and long-term risks.
The platform does not only help analysts work on cases. It helps the entire institution understand its performance.
That is essential for modern FIU governance.
A dashboard is only useful if it reflects the FIU’s real operating model.
IntelliSYS supports FIUs by configuring FIU360 dashboards, KPIs, reports, drill-down views, workflow statistics, user roles, and management reporting requirements according to institutional needs.
This may include defining key performance indicators, mapping reporting requirements, identifying management questions, configuring scheduled reports, and training users.
The goal is to create dashboards that support practical decisions.
IntelliSYS helps ensure that BI reporting is not generic, but aligned with the FIU’s mandate, workflows, risk context, and leadership priorities.
A dashboard is only useful if it reflects the FIU’s real operating model.
IntelliSYS supports FIUs by configuring FIU360 dashboards, KPIs, reports, drill-down views, workflow statistics, user roles, and management reporting requirements according to institutional needs.
This may include defining key performance indicators, mapping reporting requirements, identifying management questions, configuring scheduled reports, and training users.
The goal is to create dashboards that support practical decisions.
IntelliSYS helps ensure that BI reporting is not generic, but aligned with the FIU’s mandate, workflows, risk context, and leadership priorities.
Modern FIUs need visibility over both financial crime intelligence and institutional performance.
They must understand incoming reports, reporting entity behavior, workflow delays, analyst workloads, high-risk cases, dissemination outcomes, and emerging trends.
FIU360 supports this through BI dashboards, statistics, drill-down reporting, scheduled reports, KPIs, and management oversight tools.
For FIUs seeking to improve governance, operational performance, strategic analysis, and institutional accountability, BI dashboards should be treated as a core modernization capability.
Contact IntelliSYS to discuss how FIU360 dashboards and statistics can support your FIU’s management visibility, reporting, and performance monitoring requirements.